Log Analysis and Debugging
Log Analysis Frontend
The frontend is an Angular application which at runtime consists of static HTML, Javascript, and CSS resources which are interpreted by the browser. The logs of the frontend are therefore only available in the browser and only if you're running the frontend with "gulp serve-dev. When running with "gulp serve-prod" all calls to logger are removed and therefore will not produce any log entries. You may use the developer tools (Console, Network analysis, ...) of Chrome and Firefox by pressing F12.
Log Analysis Backend
The logs of the backend are available in the console of the backend. We don't log to the file system because our application is deployed to the cloud, see also https://12factor.net/logs. You can configure the log level in the file backend/src/resources/logback.xml for the package org.educama (default is DEBUG).
Debugging the backend
The configuration of the spring boot container is added with PR 71.
Be sure that the following lines are added to the configuration of the spring-boot-maven-plugin in the pom.xml of the backend:
 <jvmArguments>
     -Xdebug -Xrunjdwp:transport=dt_socket,server=y,suspend=n,address=5005
</jvmArguments>
Then connect to the running process via the debug port from your IDE.
| IDE | How to |
|---|---|
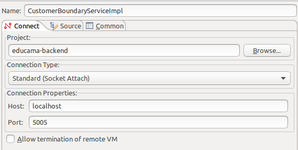
| Eclipse | Run → Debug Configurations → Remote Java Applications → New launch configuration →Change host to local host and port to 5005 (see picture below).
As soon as you click debug, Eclipse connects to your running application. Breakpoints get active and suspend the application, as soon as they are hit. |
| IntelliJ | TODO |
Database Access
When running the backend locally you can look at the in-memory database using the h2 web console which is accessible at http://localhost:8081/h2-console using JDBC URL jdbc:h2:mem:testdb.